M1: From Pixels to Meters

That clip up top: the yellow box tracking the ball on the broadcast picture, next to the same rally redrawn as dots on a plain, top-down court diagram — the ball's real position, in meters, drawn live as the rally plays out.
Last time, the software could hold onto a tennis ball for an entire rally on screen. Today's question: can it tell you whether that ball landed in the court, or a foot wide of it?
Previously: the kickoff post set the goal — teach software to watch a broadcast match and produce the point-by-point notes volunteers hand-type for the Match Charting Project, a slow, human-powered dataset the project wants to speed up. Last time, an AI followed one specific ball through a whole rally for about sixty cents. What came back was a list of screen positions — pixel coordinates, the colored dots a video frame is built from (more in Court Vision in Plain English). A screen position alone can't say whether a shot landed in or well wide.
Turning a TV picture into a court diagram
You already do this without noticing. Watch a match on TV, and when a ball lands, you can point to roughly the right spot on a paper court diagram — even though the camera sits up high behind the baseline, so the far side of the court looks small and squeezed while the near side looms huge. Your brain quietly un-squeezes it. That un-squeezing rule — turning "this spot on the TV screen" into "this spot on the court" — is what computer vision calls a homography, the screen-to-court-diagram conversion (more on it here). Software needs the recipe spelled out, and it gets one the way a chair umpire settles an argument: from the court's own painted lines. Match what the camera sees to the real dimensions — every court on earth is 10.97 by 23.77 meters — and the conversion falls out.
One catch to tuck away first: this recipe only works for things sitting on the ground. It converts the court's flat surface, not the air above it. A player's feet are on the ground, so their position converts honestly. A ball in flight isn't touching the ground, so the same recipe reports where the ball's shadow would be — not the ball. Hold onto that; it's the twist waiting at the end of this post, and it echoes through the rest of the series.
Getting an empty court for free
Finding painted lines is easier once you clear the players off them. The trick: the broadcast camera holds still for the whole rally (checked in the appendix). Stack every frame of the clip, and for each dot on screen, take the middle value it shows across every frame — its median. A player is only ever briefly at any one dot, so the middle value votes them out of existence. The lines never move, so they survive razor sharp. It's the same free trick the Plain English primer uses to explain how the pipeline later finds players — here it just clears the stage.
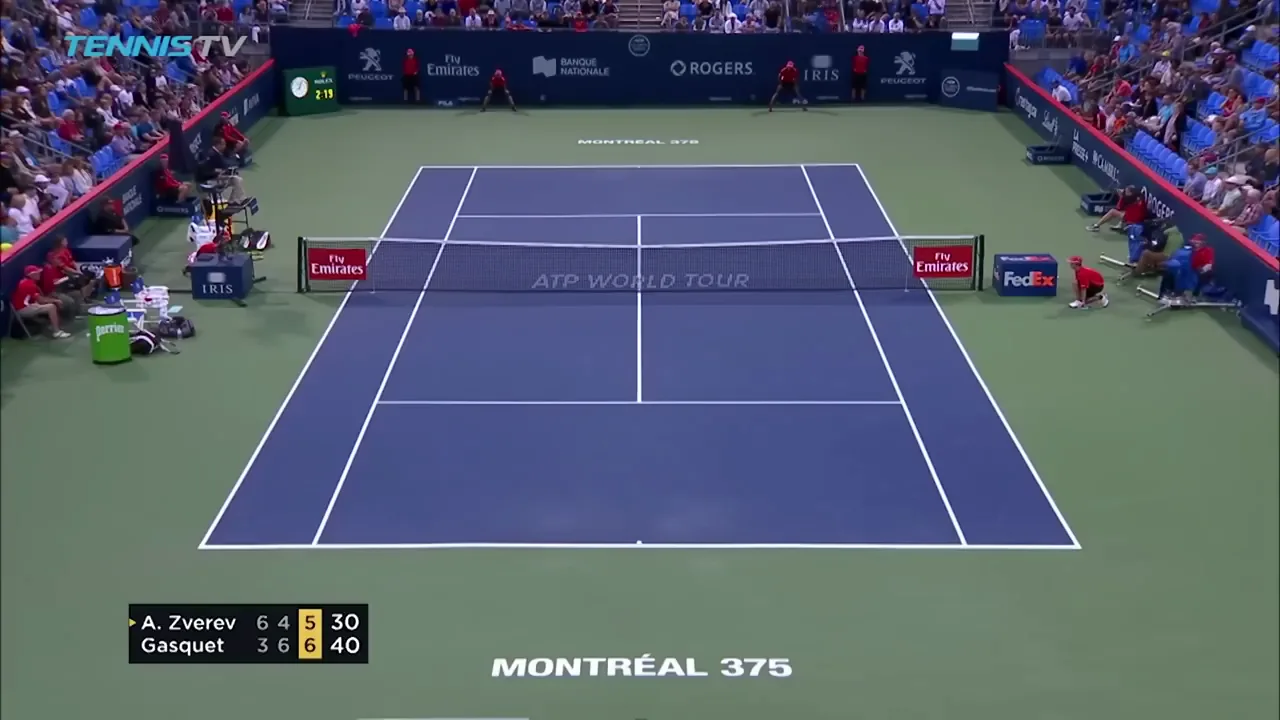
A tennis court with nobody playing tennis on it — built by stacking frames that all had somebody on it.
One line of code, and both players vanish, the ball vanishes, the lines stay razor sharp. A couple of line judges, who barely move, leave faint ghosts, and the on-screen graphics stick around too — neither matters for what's next.
Finding the lines, and one impostor
Court lines are white paint on a blue court. So: isolate the big blue rectangle first, and only look for white dots inside it. That one rule keeps the crowd's white shirts, courtside signage, and the scoreboard's text out of the search entirely; the blue court fills about a quarter of the frame.
Run a standard line-finding routine on what's left, and 48 short segments come back, covering every painted line on the court.
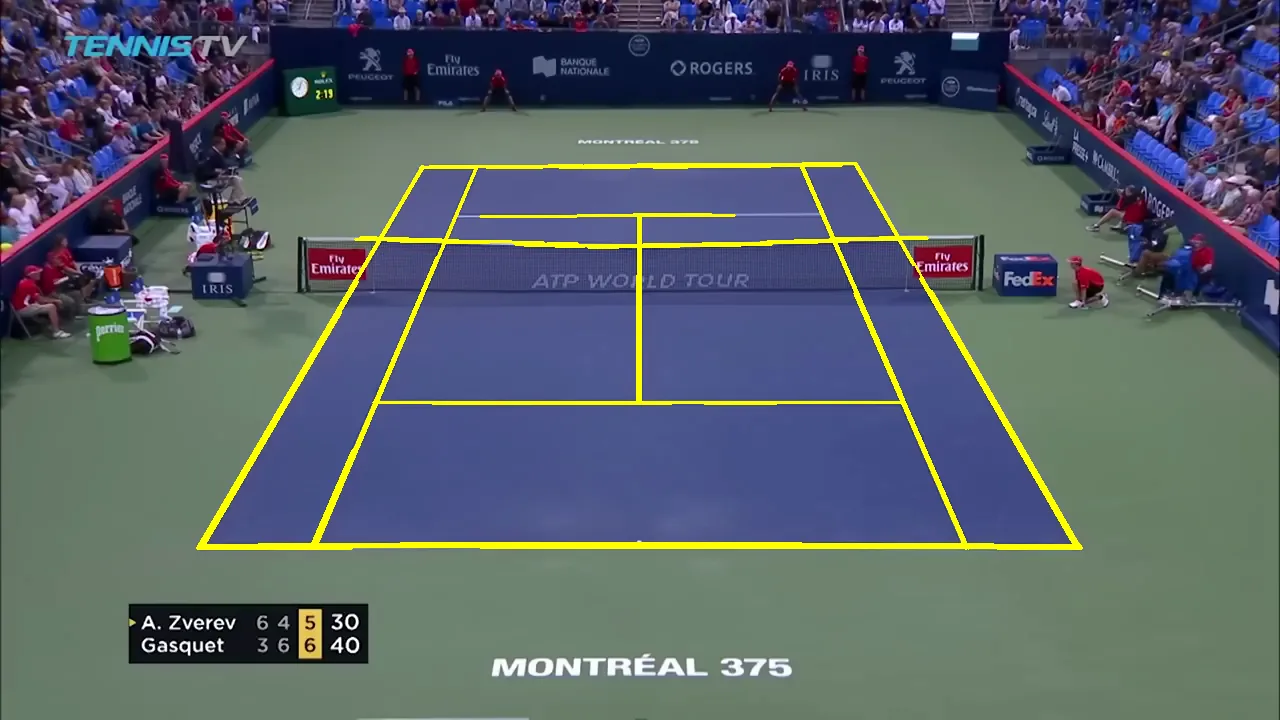
Every line the court owns — plus one it doesn't.
Every real line, except the search also grabs an impostor: the net cord reads as a line too. It's white, roughly horizontal, and stretches most of the way across the frame — but it isn't painted on the ground, and it isn't even straight; a net sags under its own weight. Any scheme that just grabbed the horizontal lines would trip right over it.
Four corners is enough
The fix is almost embarrassingly simple. Group the found lines into families — side-to-side, toward-the-camera — and keep only the outermost member of each: the top and bottom side-to-side lines are the baselines, the left and right toward-the-camera lines are the outer sidelines. The net sits in the middle by definition, so it can never be an outer line; it's excluded automatically. Cross those four outer lines and you get the court's four corners. Hand those four points, plus the court's real dimensions, to a standard piece of geometry software, and out comes the homography.
Four corners is about as little as a homography can be built from. Is it any good? The honest test: three pairs of lines never went into building the conversion at all — the singles sidelines, both service lines, and the center line. Run the full court diagram back through the conversion and see where those untested lines land.
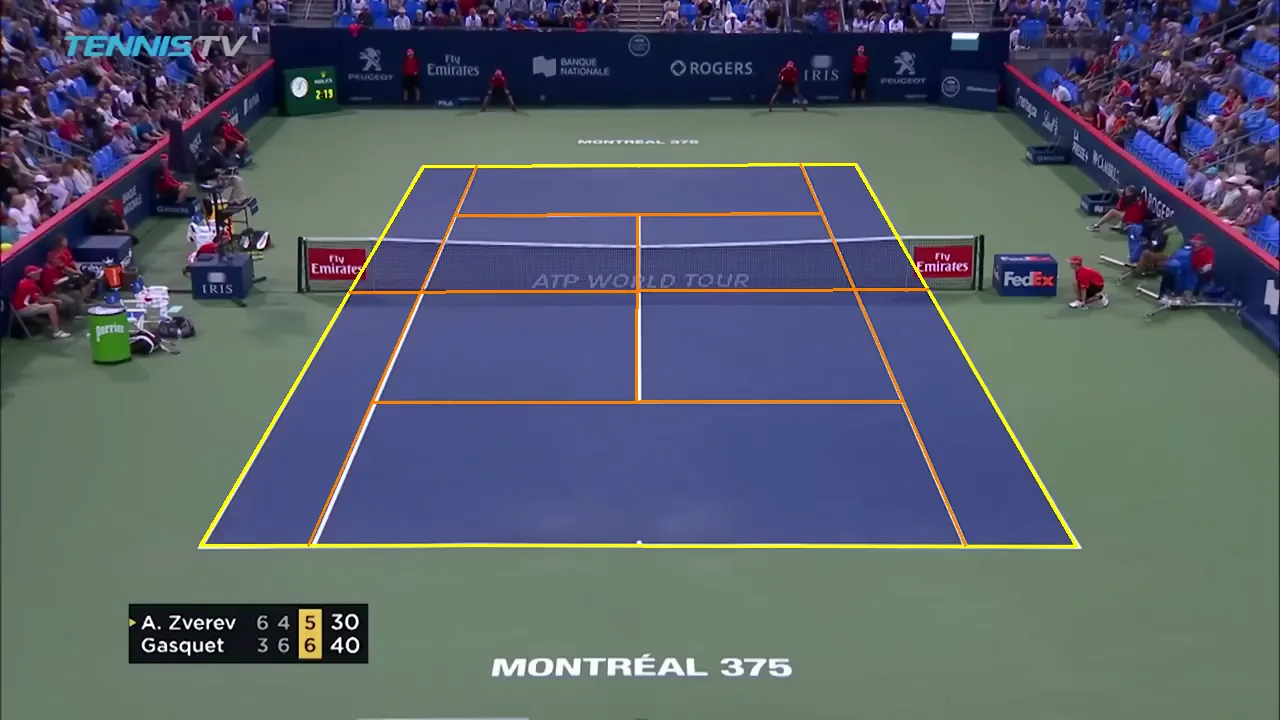
Yellow: the lines the conversion was built from. Orange: lines it had never seen before this moment — landing right on the paint anyway.
They land almost exactly on the paint, off by less than one screen dot every time. From four corners, on the first try. I had a refinement step planned in case the numbers came back rough, and deleted it.
Where does the ball actually go
Now the payoff: take last post's ball positions — one screen dot per frame — and run every one through the new conversion, then plot them on a true-to-scale court diagram.
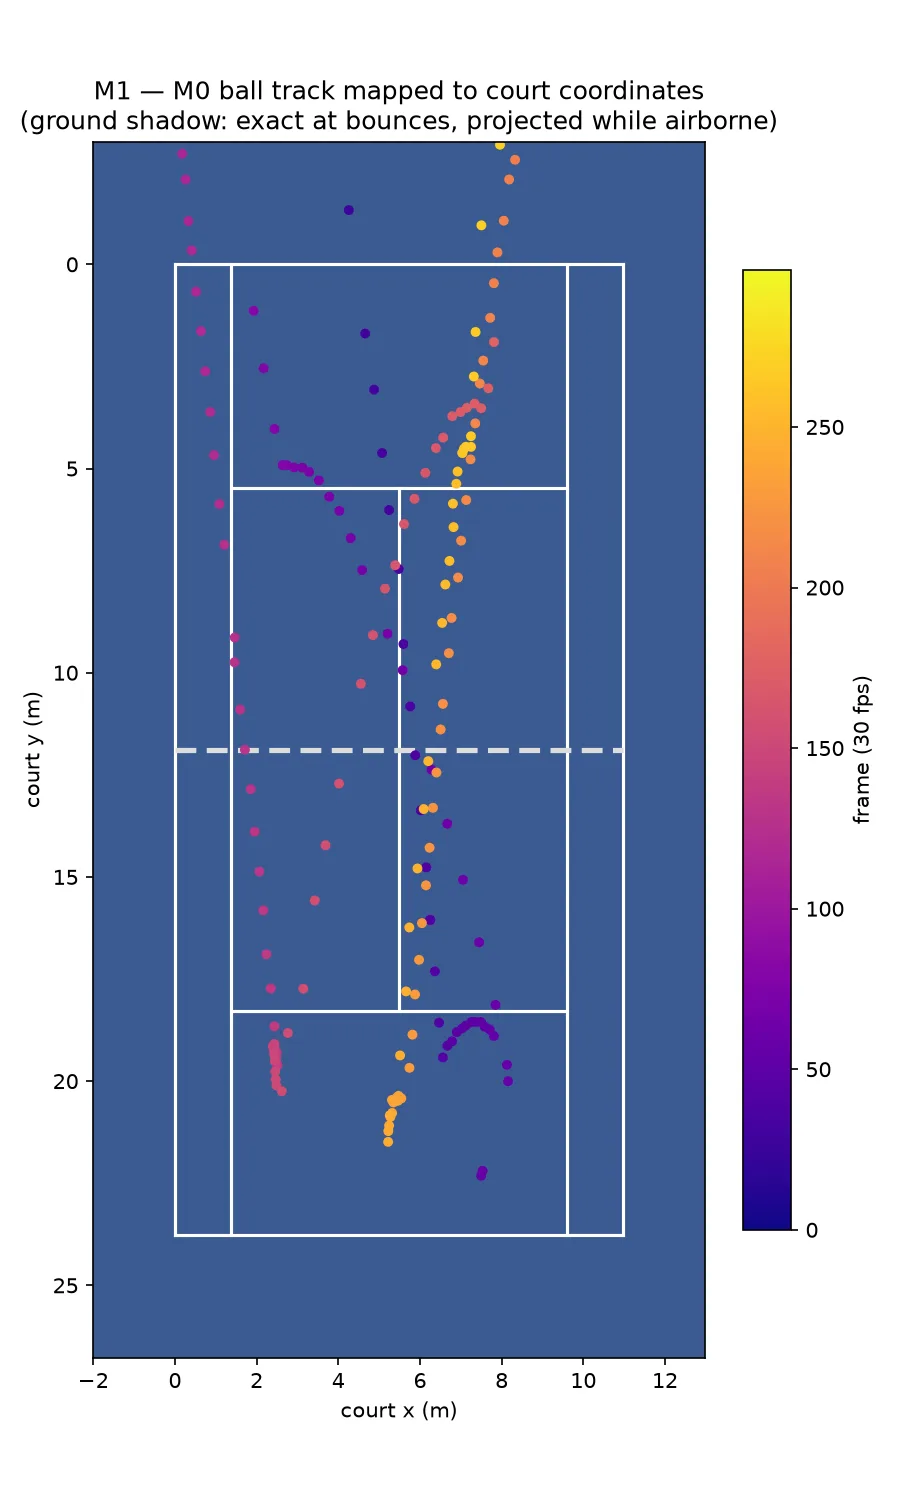
The same rally, seen from directly above for the first time. Color marks time.
Most of it reads like tennis: the ball crossing the net, dots clustering low near the baselines where players make contact. Some of it doesn't — a handful of points land more than 18 meters past the far baseline, well outside any real court. Not a fit error; the untested lines above just proved this conversion is accurate to a fraction of a screen dot. It's the catch from earlier, on schedule: the conversion only knows the ground, and a ball spends most of a rally in the air. What this chart draws, for every airborne moment, is the ball's shadow, not the ball. The shadow is truthful at exactly one instant — when the ball touches down — and drifts further from reality the higher it flies.
Which hands the next post its whole job: find the moments the ball touches the ground — the bounces — because those are the only moments this chart isn't lying.
The scoreboard
| Check | What happened | What "good" looks like |
|---|---|---|
| Camera holding still all rally | Stacked "empty court" photo lined up with frame one almost perfectly | Should land right on top |
| Lines found automatically | 48 segments, every real court line — plus the net cord, caught and thrown out | — |
| Accuracy on lines never used to build the fit | Off by well under one screen dot | Under ~1 dot = dead-on |
| Human clicks / cost | Zero clicks, $0.00 | — |
The takeaway
The ball — tennis's famous hard problem — needed a paid AI and a human's mouse click to follow. The court — the part that sounds like real computer vision — needed four corners and free arithmetic. By the end of the day, the hard problem and the easy problem had traded chairs.
For the technical reader
- Camera stability: edge IoU 0.83, sharpness ratio 0.90 (median frame
vs. frame 0) — near 1.0, no pan, one homography covers all 480 frames.
Median of 96 sampled frames via
np.median(frames, axis=0). - Court-surface isolation: largest blue contour = 26.5% of frame; white-pixel search restricted to inside it.
- Line detection: Hough transform on masked white pixels → 48 segments, clustered into 5 horizontal + 5 vertical families.
- Corner selection: extremes of each family (top/bottom horizontal = baselines, left/right vertical = doubles sidelines) → 4 corners → OpenCV perspective transform against official dimensions (10.97 × 23.77 m).
- Validation: singles sidelines, both service lines, center line held out entirely; reprojection mean error 0.0–0.8 px on those held-out lines.
- Net cord excluded automatically — never an extreme of either family. The fitted model's net line is the net's dead-straight ground projection; the real net cord sags visibly above it.
- M0's per-frame ball centroid pushed through the fitted homography onto the true-scale court model; some points land >18 m past the far baseline mid-flight — a ground-plane-only mapping meeting an airborne ball, not fit error (confirmed by the sub-pixel held-out-line result above).
- Total cost: $0.00 — zero manual clicks, zero API calls; numpy and OpenCV, run locally.
- Carried to M2: read hit/bounce events from the discontinuities in this same trajectory.
This step cost nothing — no clicks, no paid API calls, just code on my own laptop. Total for the milestone: $0.00.
Next question: the ball's path on screen is smooth curves broken up by sudden kinks. Is every kink a hit or a bounce? Time to find out if that idea survives contact with real data.