M3: The Cutting Room

That clip up top: sixty point candidates, one after another, cut automatically out of a 24-minute highlights reel — almost every one starts on a serve.
Watch a tennis broadcast and count how much of it is actually a point being played. Not much. There's a replay after nearly every big rally, a coach's-box shot, a close-up between points — actual tennis is a small slice of the screen. Today's question: can software find, on its own, only the real points inside a whole reel of broadcast footage? It can — and it turned up the best plot twist of the project so far.
The project's goal, set on day one, is software that writes the same shot-by-shot notation Match Charting Project volunteers write by hand — that first post already flagged finding the right clips as its own job, then four posts put it off. An earlier session built the conversion from screen position to court position, matched to the court's own painted lines. The most recent session called every forehand and backhand across a whole rally — but that rally was one 16-second clip that starts and ends mid-point, with no serve, ending, or score anywhere in it.
That clip's match — Zverev versus Gasquet, Montreal 2017 — also has a 24-minute extended highlights reel: same broadcast, same camera, dozens of complete points, cut together with close-ups, crowd shots, and slow-motion replays. So today's job isn't a tennis question. It's an editing-room one: out of the reel's 36,234 individual pictures, which show the real camera, and which are decoration?
The idea that worked: reusing a conversion as a fingerprint
A tennis broadcast has one main camera — high, behind the baseline, showing the whole court — the only camera a Match Charting Project volunteer could chart from. Everything else the director cuts to is a different camera, and a highlights reel is built almost entirely out of those cutaways.
The first idea, tried and broken below, was to spot the difference by color: the court is blue, the ground around it is green. What actually worked reused something already built: an earlier session's conversion from screen position to court position, the homography, fit once by matching the court's painted lines to its real dimensions (more on it here). That conversion doubles as a camera fingerprint — a test for whether a frame was shot from that one calibrated camera position. Project the true shape of a tennis court through it onto a new frame: on the main camera, the lines land exactly on the paint, because the conversion was built for that camera's position. On any other camera they miss — the projected court floats off into empty space instead of matching anything real.
Checking a frame becomes checking a few dozen spots: does court-colored paint sit where the projection says it should, and does the strip just outside the doubles lines correctly not have court paint in it? Pass both, it's the main camera. Fail either, it's a cutaway — including an actual replay, which would otherwise chart the same point twice.
Attempt one: paint colors, and why noon breaks them
The first classifier measured blue and green in each frame against a threshold, tuned on frames from late in the match. It looked great — every accepted frame really was the main camera.
Then came the check nobody skips: looking at what it rejected. Six frames were obviously real points. All from the first set. All in blazing daylight.
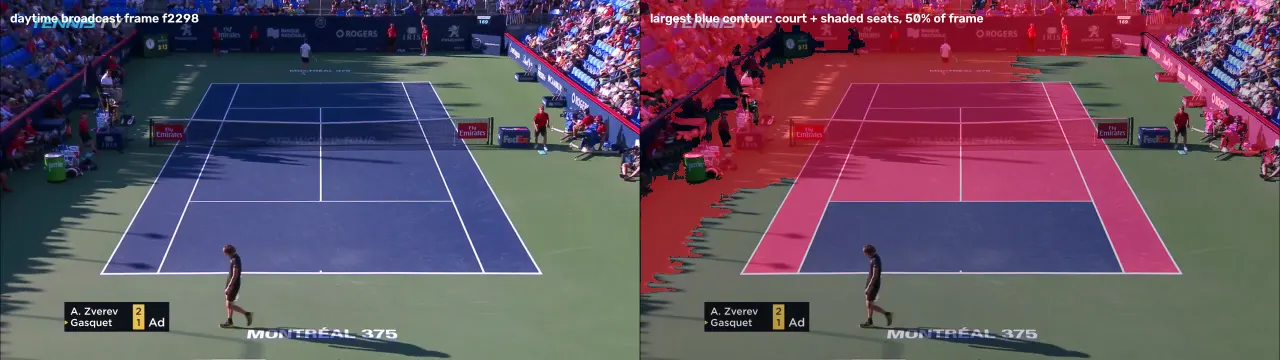
The blue region found in a daytime frame: the court and the shaded seating bowl behind it, fused into one shape covering half the picture.
Two things were going wrong, both about light. In daylight, the shaded seats read as the same blue as the court and merge into one giant shape. At the same time, the sunlit ground around the court washes out too pale to register as green. The match starts at noon in full sun and ends at night under floodlights, and a color rule tuned for one end breaks at the other.
What actually worked, in numbers
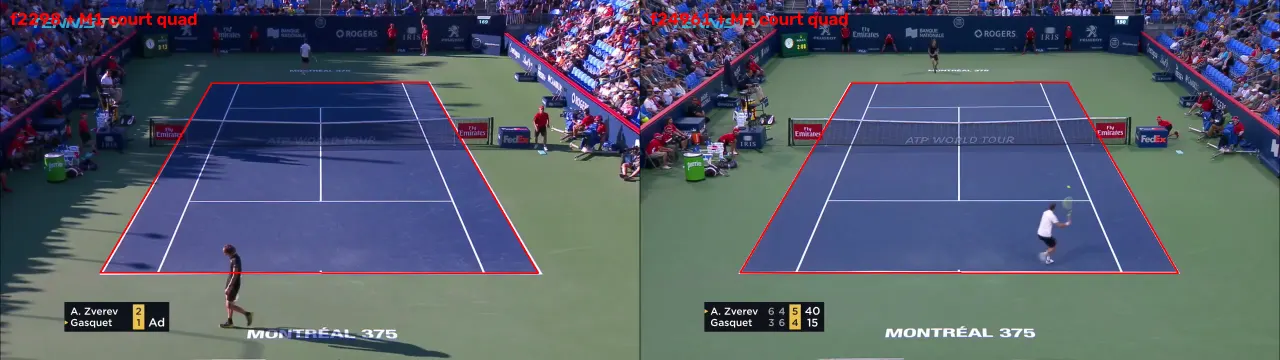
The projected court outline, laid onto two frames of the new reel — daytime and evening. Pixel-perfect on both: same broadcast, same camera.
Fifty spots that had to be court-blue, seventeen just outside the doubles lines that had to not be, checked frame by frame across the whole reel. Smooth out single-frame flickers, keep only stretches of three seconds or longer, and the reel breaks into 60 segments, 725 seconds of chartable tennis — about twelve minutes out of twenty-four.
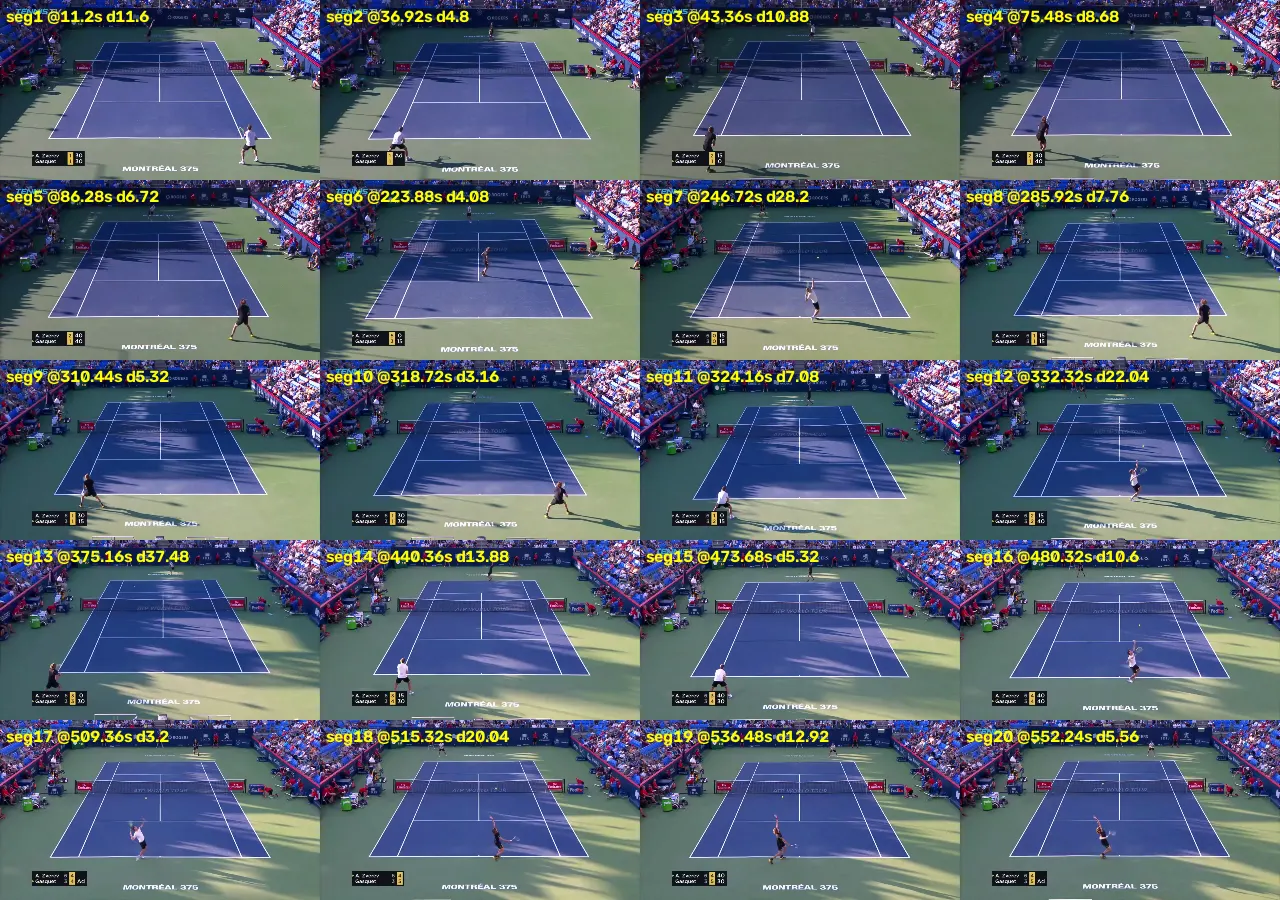
The first twenty segment openings. The service toss shows up again and again — highlight editors cut in just before the serve, so it arrives free with every cut.
All sixty openings got checked by eye: every one is a real broadcast view, every one runs to a dead ball. Broadcast editors, it turns out, already hand this project exactly the unit it needs: complete points.
Auditing the gaps, and one honest miss
Every long stretch between segments got checked too, turning up twenty genuine cutaways — including sideline and net-camera replays, failing the same way.
One gap was a real loss.
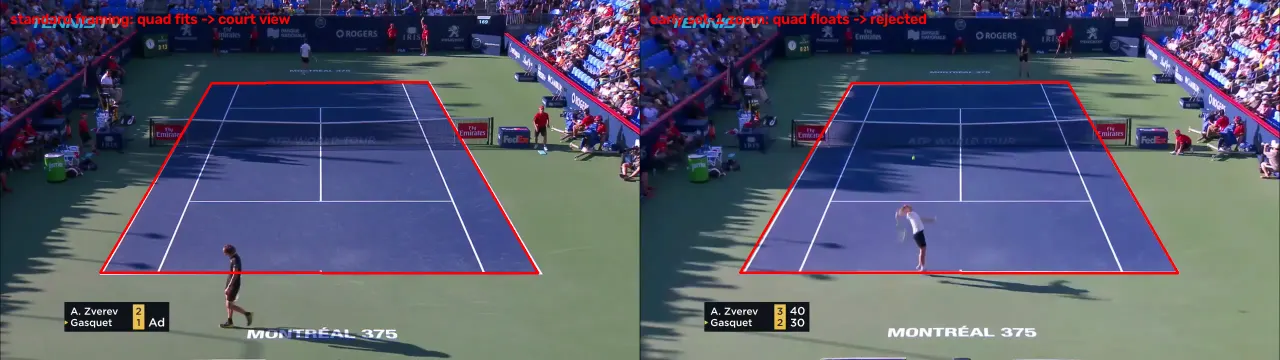
Early in set one the broadcast used a tighter zoom. The court still read correctly inside, but the bigger court filling the frame swallowed the outside-the-lines check. 131 seconds of real tennis, rejected.
The "camera never moves" assumption broke for those two minutes — a known hole, on the record. The fix, if needed: re-fit the conversion per stretch instead of once for the whole reel, which the earlier conversion work can already do automatically.

Twenty-four minutes of reel: 60 green segments found, one orange confession.
The twist buried in segment 51
All sixty candidate clips went to disk. Segment 51 stood out immediately: 59.6 seconds of unbroken main-camera footage, by far the longest of the sixty.
That's the point this match is famous for — a 49-shot rally, the one that shows up in YouTube video titles. The very first clip this project was built on turns out to be a 16-second slice from the middle of that same rally. The segment finder, which knows nothing about tennis and only checks colors and lines, found the entire point on its own — serve included.
Every session so far has been charting an excerpt of a much longer story. It just got handed the whole thing.
The scoreboard
| What was checked | Result |
|---|---|
| Frames sorted, real point or not | 36,234 |
| Real point segments found | 60, about 12 minutes of footage |
| Segment openings checked by eye | 60 of 60 correct |
| Genuine cutaways caught, replays included | 20 |
| Footage lost to a camera-zoom gap | 131 seconds |
| Longest segment found | 59.6 seconds — the match's famous 49-shot rally |
The takeaway
A tennis broadcast spends most of its time showing you everything except the tennis, so before software can chart a single point, it first has to find the one camera actually pointed at it.
For the technical reader
Source: same Zverev–Gasquet Montreal 2017 broadcast, 24-minute extended highlights reel, 36,234 frames.
v1: blue-fraction / green-fraction thresholds on HSV, tuned on late-match frames. High precision, low recall — 6 rejected frames from set one (daylight) were true positives. Two simultaneous causes: (1) shaded seating bowl reads as court-hue in daylight and merges into a single ~50%-of-frame contour; (2) sunlit apron washes out to saturation 38 vs. threshold 40.
v2: reuse the homography fit from the original 16-second rally clip as a pose check — project the court model's corners onto every reel frame. On-camera frames land pixel-perfect, daytime and evening. 50 interior sample points must read court-blue, 17 points just outside the doubles alleys must not. Boolean per frame, median-smoothed, segments trimmed to runs ≥3s. Result: 60 segments, all starts/ends manually verified.
Audit of inter-segment gaps: 20 confirmed cutaways, including sideline/net-cam replays (fail cleanly — different camera pose). One false negative: early-set tighter zoom (131s), interior probes still hit but the enlarged court swallowed the apron-margin probes. Not yet fixed: refit homography per block rather than globally; the fitting step is already automatic.
Plot twist: segment 51 = 59.6s, the match's 49-shot rally (its YouTube-title fame). The original tracked-rally clip is a 16-second excerpt from its middle.
Session cost: $0.00 — HSV thresholding + 67 pixel probes/frame (50 interior + 17 exterior). Project total: ~$0.75.
Open issue: reel is 25fps; the hit/bounce detector was tuned at 30fps, and its velocity thresholds are secretly per-frame deltas, not per-second — fps needs to become an explicit parameter before that detector runs on these clips.
Chart state: ?f2f1f1b2f2f2b?? — leading ? = unknown serve zone,
seven letter+number pairs (f2 f1 f1 b2 f2 f2 b?) = shots called last
session (shot 7's direction still open), trailing ? = unknown ending
code.
This session cost nothing — no AI calls, just color math and pixel checks. Project total: still about seventy-five cents. One thing to fix before next time: this reel plays at 25 pictures a second, while the hit-and-bounce detector was built on a clip that ran at 30, and its speed cutoffs quietly assume that number.
Every blank left in the chart — the serve, the last shot's direction, how the point ends — now lives inside these sixty clips, with a 49-shot monster in the middle waiting to stress-test everything downstream. Next: point anatomy — finding the serve inside a segment, and the ending after the last bounce.